Home / Charts / Water & Lost Object Dowsing Charts
Water Dowsing Chart for Finding Water
A working chart for water dowsing: the type of water feature, the best point to drill or dig, flow direction, depth, quality and flow. Use it to organise a site survey, alongside geology maps and local well records.
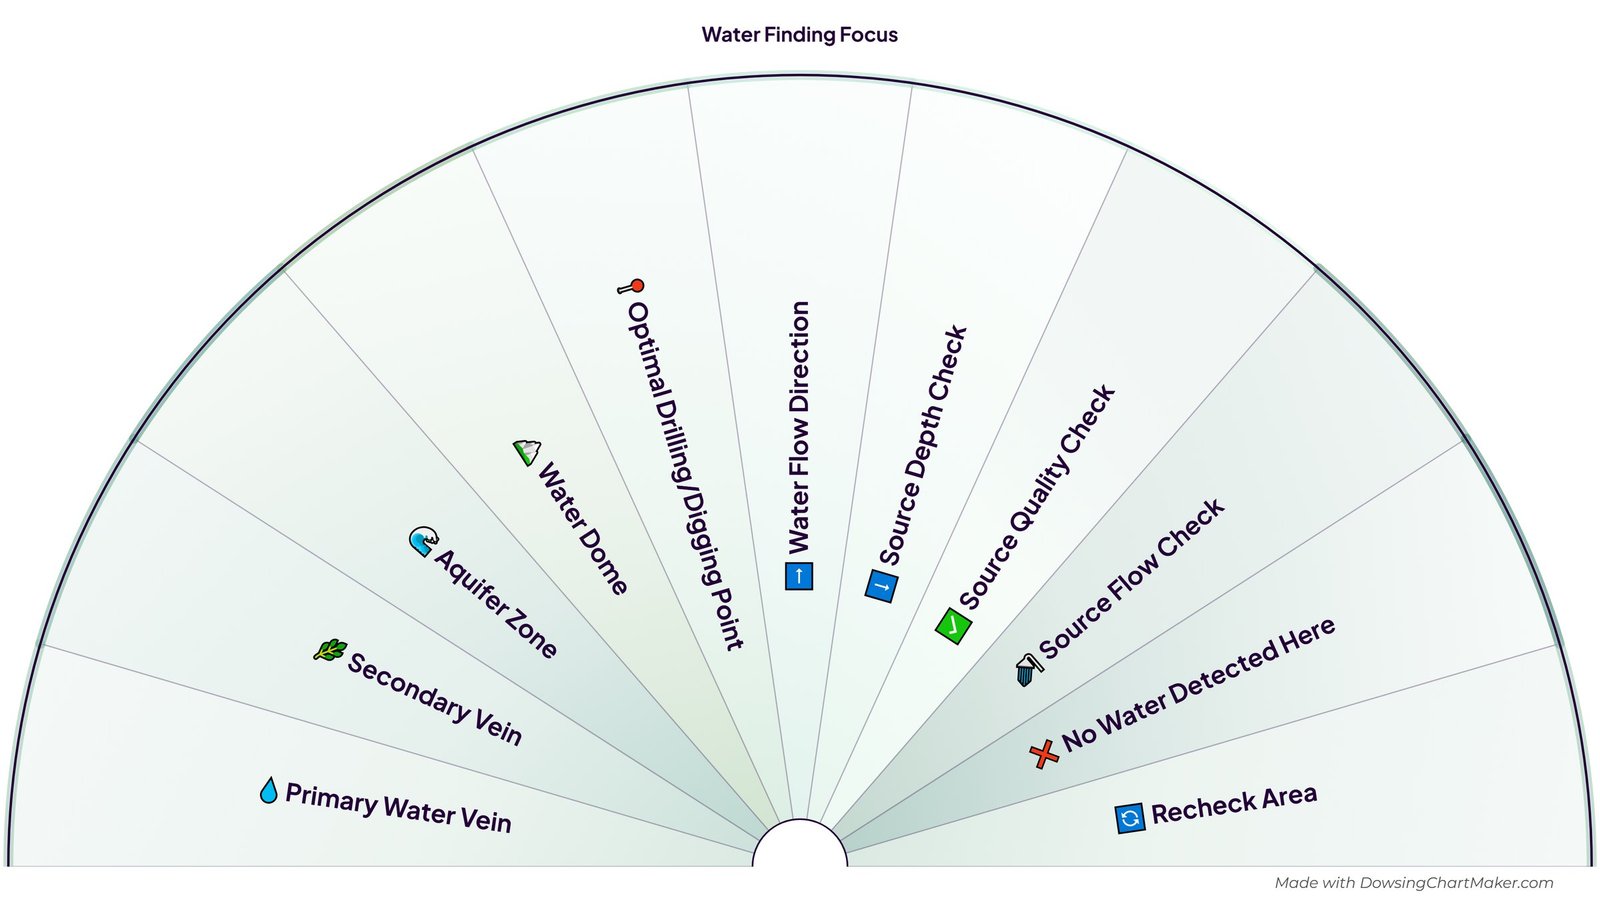
What is on this chart
This chart has 11 sections, listed here so you can read them without the image:
- 💧 Primary Water Vein
- 🌿 Secondary Vein
- 🌊 Aquifer Zone
- 🏔️ Water Dome
- 📍 Optimal Drilling/Digging Point
- ➡️ Water Flow Direction
- ⬇️ Source Depth Check
- ✅ Source Quality Check
- 🚿 Source Flow Check
- ❌ No Water Detected Here
- 🔄 Recheck Area
What each section stands for
The terms come from the dowsing tradition and do not always match the vocabulary of hydrogeology.
- 💧 Primary Water Vein — The main underground channel a dowser looks for, usually the strongest flow.
- 🌿 Secondary Vein — A smaller branch that feeds, or runs alongside, a primary vein.
- 🌊 Aquifer Zone — A layer of rock, sand or gravel that holds groundwater.
- 🏔️ Water Dome — In dowsing lore, a rounded zone where water gathers, as opposed to a line.
- 📍 Optimal Drilling/Digging Point — The spot you would choose to drill a borehole or dig a well.
- ➡️ Water Flow Direction — Which way the water is thought to be moving across the site.
- ⬇️ Source Depth Check — A prompt to estimate depth, using the depth charts linked below.
- ✅ Source Quality Check — A prompt to ask about the quality of the water, to be confirmed by testing.
- 🚿 Source Flow Check — A prompt to estimate how much water the source can supply.
- ❌ No Water Detected Here — The pendulum finds nothing at this spot, so move on.
- 🔄 Recheck Area — Not clear yet: come back, rest, and dowse the area again.
Using a chart for water dowsing
Water dowsing, also called water witching or divining, is the oldest and best-known form of dowsing. A dowser walks a site with rods, a forked stick or a pendulum, or works from a map, and notes where the tool responds. A chart like this one helps you keep the survey organised: first what kind of feature, then where to drill, then depth, quality and flow.
Be realistic about what it can tell you. Controlled tests of dowsing have generally not found results better than chance, and in many regions groundwater lies under most of the land, which is one reason dowsers can appear right. If you are drilling a borehole, which is expensive and permanent, check the local geological survey, neighbouring wells and, if you can, a hydrogeologist's survey, and treat dowsing as an extra opinion.
Never judge whether water is safe to drink from a dowsing result. Have any new source tested by a laboratory before you use it.
How to use this water dowsing chart
- Gather what you can: a sketch of the plot, any geological or well records, and notes on where neighbours have found water.
- Write down a clear question, for example “Is there a drillable water source on this plot?”
- Hold the pendulum over the chart, or over your site sketch, and ask which feature is present, one at a time. Rest between questions.
- Mark any candidate points on the sketch, then ask about the optimal drilling point and the flow direction.
- Estimate depth, flow and quality with the Studio charts linked below, and write down each answer.
- Cross-check with real-world evidence before you spend money on drilling or digging.
Companion charts for depth, flow and quality
These water-dowsing charts open in the free Studio:
- Water Depth Range (Coarse)
- Water Depth Fine-Tune (0-9)
- Water Flow Rate (Qualitative)
- Water Quality (General)
- Water Dowsing Action (drill, don't drill, recheck)
Frequently asked questions
Can dowsing really find water?
Controlled tests have not shown dowsing to work better than chance, so treat it as a prompt alongside geology and local well records, not as a guarantee. Many people still use it as part of a site survey because it fits a long tradition and costs nothing.
How do I dowse for the depth of water?
Use a coarse range chart first, then a fine-tune digit chart, and write down both answers. They are estimates. Drilling logs from nearby wells are a far better guide.
Should I use rods or a pendulum?
Both are used. Rods are common for walking a site, and a pendulum is easy to use over a map, a sketch or a chart like this one. Many people use both.
Can I change this chart?
Yes. Choose Customize in the Studio to open this chart in the free Dowsing Chart Maker. Rename or reorder the sections, change colours, fonts and layout, add layers, then export as PNG or PDF. No sign-up is needed.
Related charts
See all water & lost object dowsing charts → | Browse all charts →